
In our last blog we outlined the need for new economic models that link government economic policy with the drivers of growth at a cluster and company level. Here we will provide more detail on our answer to this challenge, the RDS Macro-Meso-Micro Model.
The RDS growth model is based on global empirical data, supported by clustering analysis which identifies and groups the key variables in a structured way. The model elucidates the correlation between macro levers that are a key part of economic policy, and meso-economic vectors which are the drivers of growth for companies as established in the development of the Triple Chasm Model.
The key components of the RDS Growth Model are as follows:
1. Rigorous definition and analysis of the macro levers and sub-levers, based on extending the macroeconomic levers typically defined by fiscal and monetary policy. These levers go beyond the traditional levers usually used by macro-economists: and are defined to fully capture the mechanisms that influence industrial policy available to a government. These levers are:
- Signalling
This is a critical overall lever because it sets the tone for how policymakers see their role in the management of markets, with all its consequences. There are 3 key sub-levers: ideological orientation, defining the governments core principles of industrial strategy; narrative that flows from this through the coherent integration of policy priorities and broader signalling in pursuit of clear goals; and finally, the quality and substance of the delivered messaging that contribute to the narrative. - Regulation
This is a very important overall lever, given how much of a particular technology, or product, can be under the control of a few major global corporations, for example in AI, who do not wish their operations to be constrained by policies determined by national governments. The sub-levers are organised by remit: focusing on market regulation, the regulation of conventional and emerging technologies and products and finally data regulation that is becoming increasingly important. - Taxation
This is well-understood as part of fiscal policy, but a more nuanced use of tax treatment can have a significant impact on growth strategy, beyond simplistic arguments about providing a low-tax environment to encourage investors. There are many aspects of taxation which need to be understood but in the context of modelling the drivers of growth, the RDS model tackles three key types of taxation: direct taxation; indirect taxation; and ‘ear-marked’ taxes designed to target specific market sectors. - Procurement
This is a critical lever which is often not addressed explicitly by policy makers, but it can have a significant impact on growth policies, particularly where the state can encourage early adoption of innovative products and services. The key sub-levers are: the state as a customer, meaning which products and services are chosen to be purchased; the efficacy and transparency of legal procurement frameworks; and public-private partnerships, defining how state agencies work with private expertise to deliver new products. - Global Drivers
This macroeconomic lever emphasizes that we cannot look at UK policy in isolation from global drivers, raising issues such technological sovereignty, regulatory trade-offs and tariffs. These sub-levers are organised into; inter-state interactions, covering bilateral treaties and engagement; security and resilience, accounting for conventional and unconventional defence considerations; and finally international market management, focused on managing tariffs and trade agreements with major markets. - Infrastructure
The design, delivery and management of infrastructure is a key macroeconomic lever when it comes to looking at growth. This covers a wide range of infrastructure including transport, energy and data. The specific sub-levers cover: physical, including major energy generation and distribution infrastructure; digital, accounting for the extent of digitalisation of national services; and ‘hybrid’ infrastructure provision, covering the facilities required to deliver digital capacity (data centres are particularly relevant to this currently). - Talent
The way in which human capital is developed and deployed is a critical macroeconomic lever when it comes to driving the growth agenda. The sub-levers break this down into how government defines the required skills for a future UK workforce; the development and delivery of suitable training initiatives; and the availability of roles for the deployment of new and existing talent. - Funding
This is one of the most critical macroeconomic levers because it tackles how the UK addresses the funding of interventions to create growth, currently bounded by the detailed fiscal rules embodied in the Green Book – it is clear that decisions made here will be subject to pressure from large institutional investors and bond markets. This is separated into public funding, private investment and the extent of effective public-private crowding-in funding.
2. Detailed examination and definition of the meso-economic vectors which drive growth in all eco-systems. This defines the following Vectors adopted from the Triple Chasm Model
- Market Spaces
The Market Space vector addresses the structure of a market space, particularly how value is created, transformed and delivered for a specific type of product or service. It avoids conventional approaches to industry classification which are less useful when looking at innovation-led growth. - Proposition Framing
The Proposition Framing vector defines how a proposition fits into the structure of the market space value chain and explores the regulatory, positioning and competitive implications. - Customer Definition
The Customer Definition Vector provides a clear, structured understanding of the target for a proposition and how customers and users will engage with it. It moves beyond generic “customer” language and provides a practical way to classify customer types, understand user–customer relationships, and assess how well the proposition fits their needs. - Distribution, Marketing & Sales
This vector defines how propositions will reach customers and how demand will be created, converted and supported over time. It brings together the practical elements of market access: how the proposition will be distributed, how customers will be engaged, and how sales activity will scale. - Technology Development & Contingent Deployment
The Technology Development & Contingent Deployment vector defines how technology enables the proposition and how it will be deployed in the market. It clarifies the role of technology, the structure of the technology stack, and the partners required to build, integrate and operate it. - Intellectual Property Management
The IP Management vector defines how a venture will describe, protect and exploit the intellectual assets that underpin its proposition. It covers all forms of IP – registered, unregistered and open – and helps teams understand what they own, what they need access to, and how they will secure Freedom to Operate in their chosen market spaces. - Product Synthesis
The Product Synthesis vector defines the product or service that will be taken to market by combining technology, customer needs and market expectations into a coherent, deliverable proposition. It uses the 9-Layer Model to help ventures understand the full set of elements that make up a product (or portfolio of products) – not just the underlying technology. - Manufacturing & Deployment
The Manufacturing & Deployment vector assesses how a venture will produce, assemble, distribute and support its product or service at scale. It clarifies the manufacturing requirements, the deployment approach, and the partners and processes needed to deliver the proposition reliably and sustainably. It is becoming especially important in new services based on large volumes of data. - Human Capital
The Human Capital vector defines the people, skills, leadership, organisational structures and culture required to commercialise a proposition. It helps ventures understand what capabilities they need, how they will access them, and how the organisation should evolve as the venture progresses. - Funding & Investment
The Funding & Investment vector defines how a venture will secure the financial resources needed to develop and commercialise its proposition. It helps teams understand the full range of funding options, the motivations of different funders, and how their valuation and expectations will evolve over time. Early-stage teams sometimes over-emphasise venture capital (VC), even though the data shows that only a small percentage of ventures receive VC investment. - Strategic Positioning
The Strategic Positioning vector defines how a venture will differentiate itself and where it will focus its effort as it moves through development and commercialisation. It brings together insights from the external vectors (market space, ecosystem, customer, competition) and the internal vectors (technology, product, manufacturing, people, funding) to determine the most credible and defensible position the venture can take. - Business Models
The Business Models vector defines how a venture will create, deliver and capture value — not just once, but through the evolution of multiple business model options as the proposition matures. It helps teams understand the variables that shape a viable model, the assumptions that underpin it, and the pathways through which revenue, cost and value can scale.
3. Re-thinking the role of the micro layer: replacing abstract ideas of the ‘perfect’ firm with the recognition that the product, rather than the firm, is the key unit of analysis when it comes to understanding growth.
Microeconomics is conventionally defined as the branch of economics that studies the behaviour of individuals, households, and firms in making decisions about the allocation of scarce resources, based on the assumption that free markets will generally drive the most ‘desirable’ outcomes. Despite substantial evidence against this, there are still many attempts to build sophisticated mathematical models under this assumption.
The Triple Chasm Model, however, demonstrated clearly that the most useful unit of analysis in understanding growth is the product being developed by a firm. The maturity of this product relative to the 3 chasms, defined more precisely by the Commercialisation Readiness Level (CRL) is actually the most useful metric from the micro-economic layer.
4. Understanding the coupling between the meso and micro layers when it comes to understanding the specific drivers of growth.
The relationship between the maturity of a product and the meso-economic drivers which govern its growth trajectory, has been examined in detail, based on a large body of empirical data, over the last two decades, and this provides a solid foundation for the overall understanding of growth in eco-systems, with multiple players operating across a wide range of ecosystems covering different geographies, market spaces, and technologies.
The biggest challenge the RDS Growth Model needs to tackle head-on is how macro-economic levers interact with the meso-economic vectors in the eco-systems where growth is actually generated.
5. Coupling between the full macro levers and the meso-economic vectors holds the key to state-inspired interventions to stimulate and manage growth
The coupling between macro-economic levers (and sub-levers) and meso-economic vectors holds the key to understanding how government interventions can affect the growth trajectory.
Our systematic approach to doing this is based on 3 key components:
a. Highly granular approach based on quantifying the coupling between each macro lever (and sub-lever) vs each of the meso-economic vectors
b. The coupling ‘strength’ is defined based on the performative metrics approach used in the development of the Triple Chasm Model. Specifically, this is based on the relevance level, R, of this coupling and the level of execution, E, in achieving it in practice. The coupling intensity is then calculated as CI=R X E
c. This generates a large volume of data, which we need to interpret. To do this, we look for patterns in this large granular data set, in particular, looking for differences between the current situation and the desired strategic objective
This is illustrated best through thedeployment of our Macro-Meso tool, where we have already provided our own assessment of the gap between theUK’s current AI policy platform, and where it needs to be.
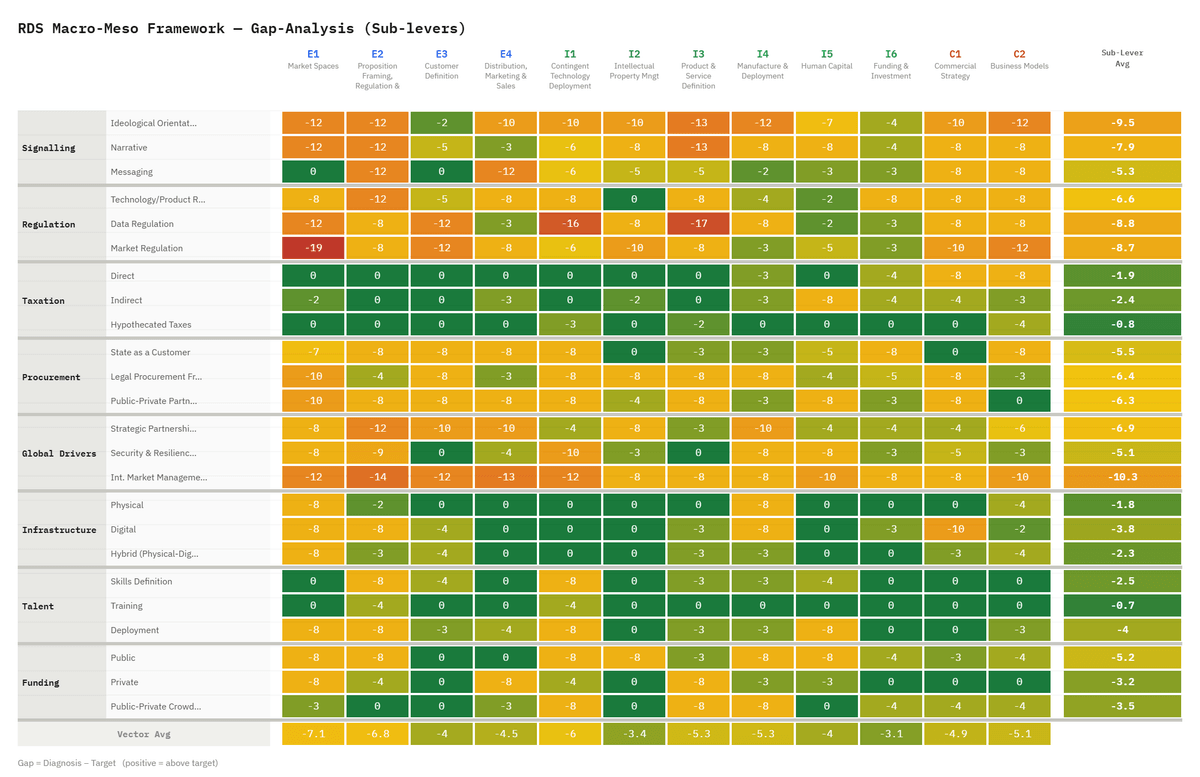
RDS Macro-Meso Framework Assessment of the UK’s AI Policy Gap
We set out below some of the specific features of this coupling which need consideration at the macro-economic level (this drives our detailed analysis for each thematic area):
Signalling: Policies on ideological orientation, the narrative and messaging will clearly have an impact at the meso-economic level; how confidently businesses can predict upcoming policy allows them to prepare and develop their own practices even if said policies are still under development. Furthermore, effective messaging and a consistent narrative boost awareness of the available opportunities for new businesses.
Regulation: Policies around regulation have the potential to affect Proposition Framing, Customer behaviour and the shape of the product and how it is deployed. This will be reflected in the ‘coupling’ scores
Taxation: The impact of macro-economic tax policies needs to be ‘converted’ into differences in the relative importance of meso-economic vectors. For example, indirect taxation will likely impact the funding and investment vector quite significantly
Procurement: Macro-economic policies around procurement could affect the shape of products and services and how they are deployed; for example, preferential treatment of innovative SMEs rather than ‘uniform’ procurement environments
Global Drivers: this is one of the most volatile areas, given the experiences of the last few years, but taking a more explicit position could help to shape policies for UK companies in highly distorted global markets
Infrastructure: Macro-economic policy towards infrastructure funding and procurement could have a significant impact on market structures and funding and investment, particularly in hybrid structures
Talent: Governments are good at recognising skills gaps and putting in place long-term policies to address them; but some of the more dynamic changes around specific technologies and products probably require more clarity which this macro-meso coupling could provide
Funding: This is obviously a key area, but the macro-meso coupling should allow a more nuanced view on crowding-in funding beyond simply exhorting large investors to be more patient; understanding the patterns in this area could help to shape better policy decisions.
Policy Development using the RDS Growth Model
The RDS has made great use of this framework in focusing on specific thematic initiatives. Beginning with UK AI policy, readers can expect a detailed initial assessment of the state of the national policy platform in the coming weeks. Stay tuned for our next blog summarising our main conclusions on how to design a policy platform for Forging the UK’s AI Future.